
What is overfit ?
Overfit is somehow what happens when you “train your model too much”. In that case, you achieve a very good training accuracy, while the test accuracy is usually poor. Think about a one dimensional regression. You may either fit a straight line, or draw a line that passes through every point. Which one will generalize best ?
In the cases of some models, there are some specific parameters that can control the balance between “passing through every point” and “drawing a straight line”. In the case of gradient boosting, this will be the number of trees, in the case of neural networks, it will be the number of iterations in the gradient descent, in the case of support vector machines, a combination of parameters…
A quite common figure regarding overfit is the following:
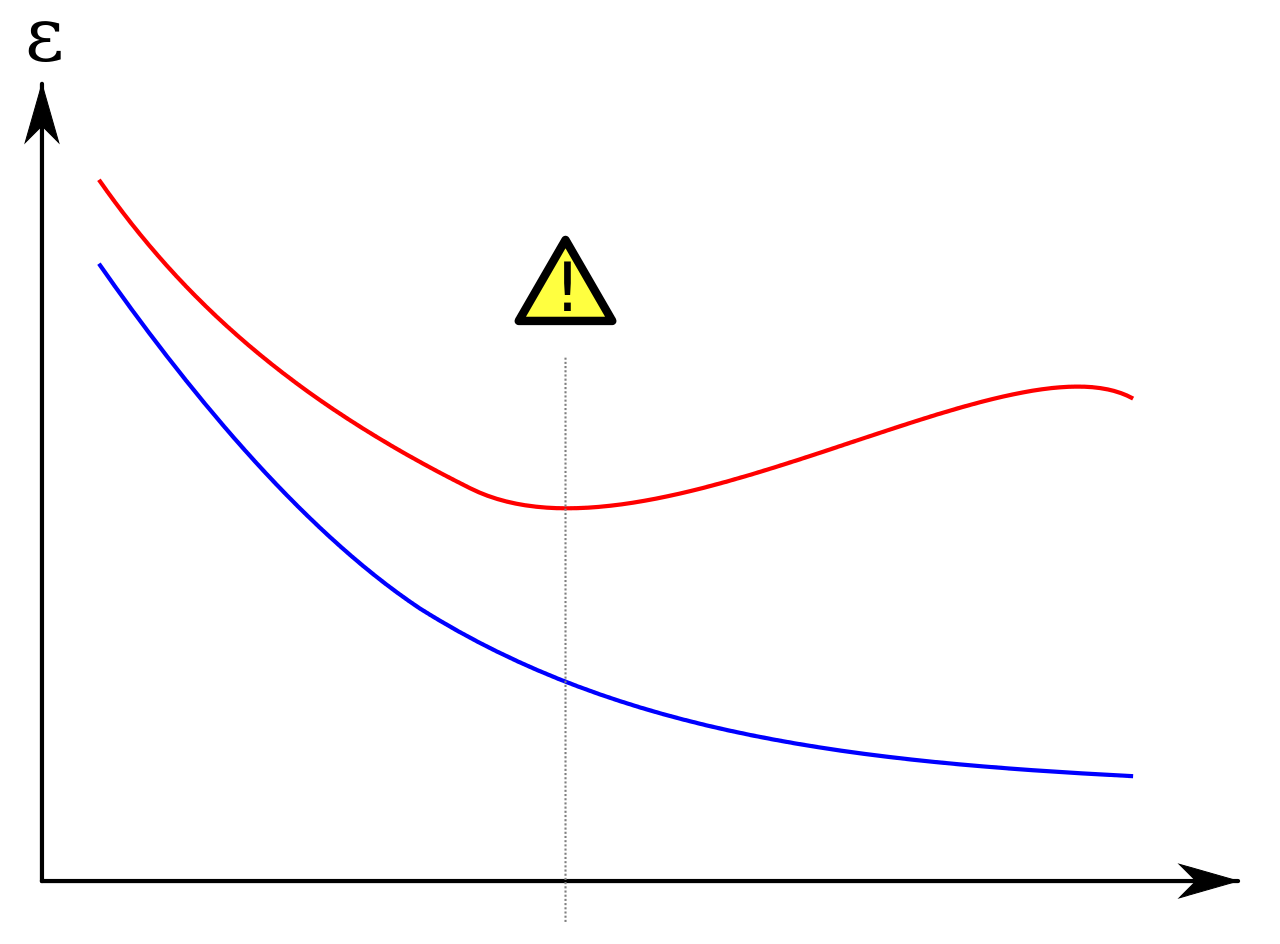
It applies mostly to neural network, where the abscissa represents the number of epochs, the blue line the training loss and the red line the validation loss.
The same question applies to gradient boosting, where the number of trees if quite critical and could replace the abscissa on the upper graph, see per example this question. Some people seem to claim that it should not overfit (as random forest do not overfit).
Simulations
A cool python library
While looking for bencharmk data, I found pmlb which stands for Penn Machine Learning Benchmark. Basically it enables to download different real word datasets.
More info can be found in the project page.
Method
I used xgboost for which I simply increased the number of trees.
for n_trees in [10, 20, 50, 100, 200, 1000, 1500, 2000, 3000, 4000, 10000, 30000]:
    for max_depth in [5]:
        for learning_rate in [0.001]:
            yield {
                    "name": "XGBClassifier",
                    "parameters": {
                        "n_estimators": n_trees,
                        "max_depth": max_depth,
                        "learning_rate": learning_rate,
                        }
              }
On the following datasets:
['heart_statlog', 'hepatitis', 'horse_colic', 'house_votes_84', 'hungarian', 'hypothyroid', 'ionosphere', 'iris', 'irish', 'kr_vs_kp', 'krkopt', 'labor', 'led24', 'led7', 'letter', 'lupus', 'lymphography', 'magic']
The performance of each model was then evaluated using a 5 folds cross validation for the following metrics ["roc_auc", "accuracy", "neg_log_loss"].
Does xgboost overfit ?
The graphs below seem to say that increasing the number of trees may harm the performance of the model. However, in some cases, even very large number of trees are beneficial to the model.
Graphs


Comparison with random forest
However, the comparison with random forests is needed to understand what was at stake above:


Code
from pmlb import fetch_data
import pandas as pd
import numpy as np
from sklearn.model_selection import cross_validate
from model_builder import model_builder


def run(model_parameters, dataset_key, metrics):
    model = model_builder(model_parameters)
    X, y = fetch_data(dataset_key, return_X_y=True)
    if len(np.unique(y)) != 2:
        print("Problem is not binary")
        return None

    res = cross_validate(model, X, y, scoring=metrics)

    row = {
            "fit_time": np.mean(res["fit_time"]),
            "n": X.shape[0],
            "p": X.shape[1]
            }
    for metric in metrics:
        row[metric] = np.mean(res[f"test_{metric}"])
        row[f"{metric}_std"] = np.std(res[f"test_{metric}"])
    return row


def benchmark():

    for n_trees in [10, 20, 50, 100, 200, 1000, 1500, 2000, 3000, 4000, 10000, 30000]:
        for max_depth in [5]:
            for learning_rate in [0.001]:
                yield {
                        "name": "XGBClassifier",
                        "parameters": {
                            "n_estimators": n_trees,
                            "max_depth": max_depth,
                            "learning_rate": learning_rate,
                            }
                    }

dataset_keys = ['heart_statlog', 'hepatitis', 'horse_colic', 'house_votes_84', 'hungarian', 'hypothyroid', 'ionosphere', 'iris', 'irish', 'kr_vs_kp', 'krkopt', 'labor', 'led24', 'led7', 'letter', 'lupus', 'lymphography', 'magic']
rows = []

for dataset_key in dataset_keys:
    for model in benchmark():
        row = run(model, dataset_key, ["roc_auc", "accuracy", "neg_log_loss"])
        if row is not None:
            row["model"] = model["name"]
            row["data"] = dataset_key
            row = {**row, **model["parameters"]}
            print(row)
            rows.append(row)

output_data = pd.DataFrame(rows)
output_data.to_csv("./xgb_overfit.csv", index=False)
And the graphs can be produced easily using the nice .plot() methods proposed by pandas and matplotlib.
import pandas as pd
import matplotlib.pyplot as plt

for metric in ["roc_auc", "accuracy", "neg_log_loss"]:
    benchmark_data = pd.read_csv("xgb_overfit.csv")
    benchmark_data.set_index("n_estimators", inplace=True)
    benchmark_data.groupby("data")[metric].plot(legend=True, logx=True, title=metric)
    plt.legend(loc="lower left")
    plt.savefig(f"xgb_{metric}.svg")
    plt.clf()
References
-
xgboost one of the best gradient boostin libraries available.
-
pmlb a Python library providing various benchmark datasets.