
Introduction
OCaml seemed to lack a decent library for scientific computing. I came across Owl and the official repo and wanted to give it a try.
It has support for matrix operations, dataframes, simple plots based on PLplot (I used a port of PLplot which was quite undocumented in OCaml)…
Install Owl
On my Ubuntu (16) it all starts with…
opam install owl
Unfortunatley, soon enough:
[ERROR] The compilation of conf-openblas failed at "sh -exc cc $CFLAGS test.c -lopenblas".
Opam suggests me the following:
=-=- conf-openblas.0.2.0 troobleshooting =-=-=-=-=-=-=-=-=-=-=-=-=-=-=-=-=-=-=-=
=> This package relies on external (system) dependencies that may be missing. `opam depext conf-openblas.0.2.0' may help you find the correct installation for your system.
After executing the command opam depext conf-openblas.0.2.0, the following packages are installed:
The following additional packages will be installed:
  liblapacke libopenblas-base libtmglib-dev libtmglib3
And re-running:
opam install owl
It works ! Let’s get started
Examples
SVMs
The package comes with a list of examples. Let’s start with support vector machines! Note that I removed the first line from the actual version of the example below.
(* This example demonstrates SVM regression. *)

open Owl

let generate_data () =
  let open Mat in
  let c = 500 in
  let x1 = (gaussian c 2 *$ 2.) in
  let a, b = float_of_int (Random.int 15), float_of_int (Random.int 15) in
  let x1 = map_at_col (fun x -> x +. a) x1 0 in
  let x1 = map_at_col (fun x -> x +. b) x1 1 in
  let x2 = (gaussian c 2 *$ 2.) in
  let a, b = float_of_int (Random.int 15), float_of_int (Random.int 15) in
  let x2 = map_at_col (fun x -> x +. a) x2 0 in
  let x2 = map_at_col (fun x -> x +. b) x2 1 in
  let y1 = create c 1 ( 1.) in
  let y2 = create c 1 ( -1.)in
  let x = concat_vertical x1 x2 in
  let y = concat_vertical y1 y2 in
  x, y


let draw_line x0 y0 p =
  let a, b, c = 0., 20., 100 in
  let x' = Mat.empty 1 c in
  let y' = Mat.empty 1 c in
  for i = 0 to c - 1 do
    let x = a +. (float_of_int i *. (b -. a) /. float_of_int c) in
    let y = (Mat.get p 0 0 *. x +. Mat.get p 2 0) /. (Mat.get p 1 0 *. (-1.)) in
    Mat.set x' 0 i x; Mat.set y' 0 i y
  done;
  let h = Plot.create "plot_svm.png" in
  Plot.(plot ~h ~spec:[ RGB (100,100,100) ] x' y');
  Plot.(scatter ~h ~spec:[ RGB (150,150,150) ] x0 y0);
  Plot.output h


let _ =
  let _ = Random.self_init () in
  let x, y = generate_data () in
  let r = Regression.D.svm ~i:true x y in
  let p = Mat.(r.(0) @= r.(1)) in
  draw_line (Mat.col x 0) (Mat.col x 1) p;
  Owl_pretty.print_dsnda Mat.(r.(0) @= r.(1))
Using OCamlBuild, the only thing to do is to write the following small script:
ocamlbuild -use-ocamlfind -pkgs 'owl' svm.byte
./svm.byte
rm svm.byte
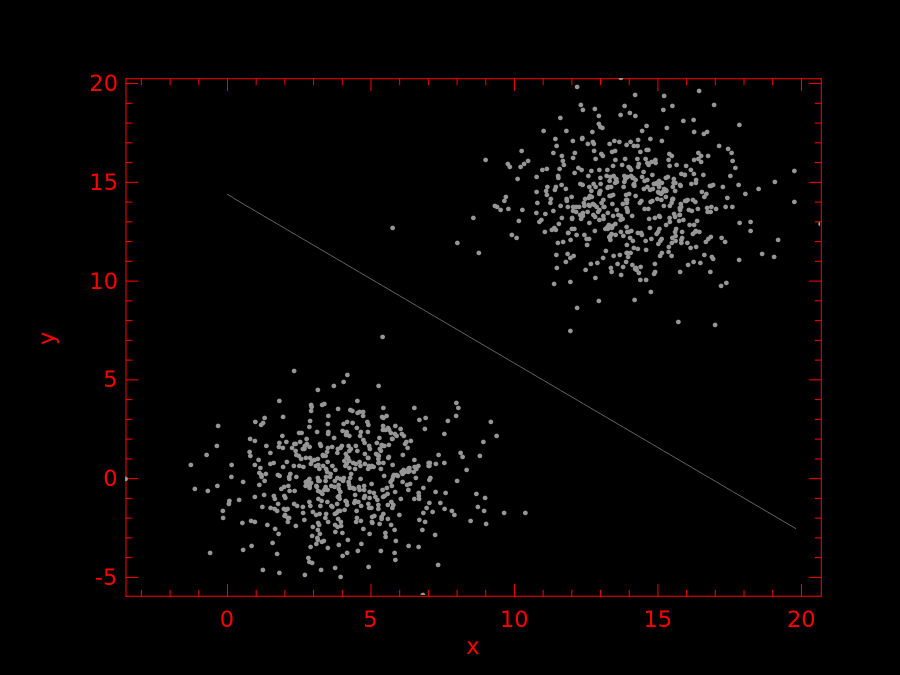
The algorithm should output the following:
--- Training config
    epochs         : 1000
    batch          : full
    method         : gradient descent
    loss           : Hinge
    learning rate  : adagrad 1
    regularisation : l2norm (alhpa = 0.001)
    momentum       : none
    clipping       : none
    stopping       : const (a = 1e-16)
    checkpoint     : none
    verbosity      : true
---
2019-04-15 14:12:02.638 INFO : T: 00s | E: 1.0/1000 | B: 1/1000 | L: 1800.944031[-]
2019-04-15 14:12:02.640 INFO : T: 00s | E: 2.0/1000 | B: 2/1000 | L: 1986.033647[▲]
2019-04-15 14:12:02.641 INFO : T: 00s | E: 3.0/1000 | B: 3/1000 | L: 851.791568[▼]
2019-04-15 14:12:02.641 INFO : T: 00s | E: 4.0/1000 | B: 4/1000 | L: 256.961005[▼]
2019-04-15 14:12:02.642 INFO : T: 00s | E: 5.0/1000 | B: 5/1000 | L: 81.197291[▼]
2019-04-15 14:12:02.643 INFO : T: 00s | E: 6.0/1000 | B: 6/1000 | L: 38.378032[▼]
2019-04-15 14:12:02.644 INFO : T: 00s | E: 7.0/1000 | B: 7/1000 | L: 22.740718[▼]
2019-04-15 14:12:02.644 INFO : T: 00s | E: 8.0/1000 | B: 8/1000 | L: 15.785715[▼]
2019-04-15 14:12:02.645 INFO : T: 00s | E: 9.0/1000 | B: 9/1000 | L: 11.920411[▼]
And produce the following plot (or something similar since the data is generated randomly).
Plots
A full tutorial can be found here. Having used PLplot before, it is indeed much lighter!
open Owl

(* N(0,1) sample *)
let y = Mat.gaussian 5000 2 ;;

(* Initiates the plot *)
let h = Plot.create "me.png" ;;

(* Side effects *)
Plot.set_background_color h 255 255 255;

(* More side effects *)
Plot.set_title h "Bivariate model";

(* Simple scatter *)
Plot.scatter ~h (Mat.col y 0) (Mat.col y 1);
Plot.output h;;
Matrix operations and Monte Carlo
Playing with matrices, broadcasting operations… is quite easy and the syntax prevents you to substract floats and matrices without knowing it. Which is, from my point of view, a good thing. Let’s implement a simple variance reduction method based on the generation of antitethics random variables (see per example this course).
let antithetic_simulation mu sigma n =
    let sample = Mat.gaussian ~mu:mu ~sigma:sigma (n/2) 1 in
    let anti_sample = Mat.((2. *. mu) $- sample) in
    Mat.(sample @= anti_sample)
The various operations in Mat.( ... ) have different meanings. The $- stresses that we are dealing with a float on the left hand side and a matrix on the right hand side, whereas the @= stands for the vertical concatenation of matrices. All the details can be found on the offical website.
Other ressources
Merlin
Given the large number of functions (more than 7000 !), Merlin is a must have!
Concluding remarks
I have just been playing with this new library for a couple of days, but it is promising! What is next ? Maybe benchmarks, tutorials ? Using GPU with Owl ? Let me know in the comments :)